Over $100,000 in Sales and 2,381 Units in 7.5 Months
A first-time seller's debut kitchen product, taken from sourcing in China to a live Amazon US listing — and past $100,000 in ordered product sales within seven and a half months of launch.
The Brief
A client came to us wanting to launch their first ever product on Amazon. They had no existing catalogue and no established brand — only the ambition to get one product right. We spent a month on product research before settling on a kitchen item with steady demand and room in the margin to advertise.
From there we ran the whole launch: packaging selection, sourcing from China, shipping and FBA logistics, the listing itself, and the PPC campaigns that carried it into the rankings.
What We Did
Product Research
A month of market and margin analysis before committing to a product, so the numbers worked before a single unit was ordered.
Sourcing & Packaging
Kicked off in June 2024 with packaging selection and sourcing from China, managing the supplier relationship and the shipment through to FBA.
Launch
The product went live on Amazon at the end of September 2024, with the listing and first shipment ready to go.
PPC and Ranking
Campaigns went live alongside the listing, with a keyword set chosen for ranking rather than vanity traffic. The product reached the top of search results within seven days.
The Unit Economics
The product was chosen because the maths worked before any advertising. These are the per-unit figures the launch was planned against.
$12.00 manufacturing
The per-unit cost from the supplier in China.
$0.50 shipping
Per-unit freight, giving a landed cost of $12.50.
$5.37 FBA fee
Amazon's fulfilment fee per unit.
$6.00 referral fee
Amazon's commission on each sale.
$24.50 break-even
The price at which the product covers all of the above.
40% target margin
The margin the launch was planned to hold at scale.
Performance Evidence
Unedited Sales Snapshot exports from Amazon Seller Central, watermarked but otherwise untouched. Every snapshot was taken on 21 May 2025.
Each figure is cumulative from 1 October 2024, the first full month on sale, so each block shows the running total to that date rather than the sales made within that window alone.
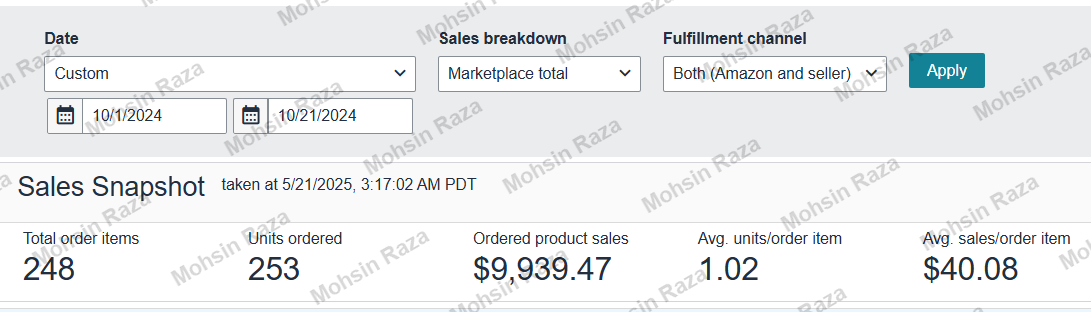
First 21 Days
1 Oct - 21 Oct 2024
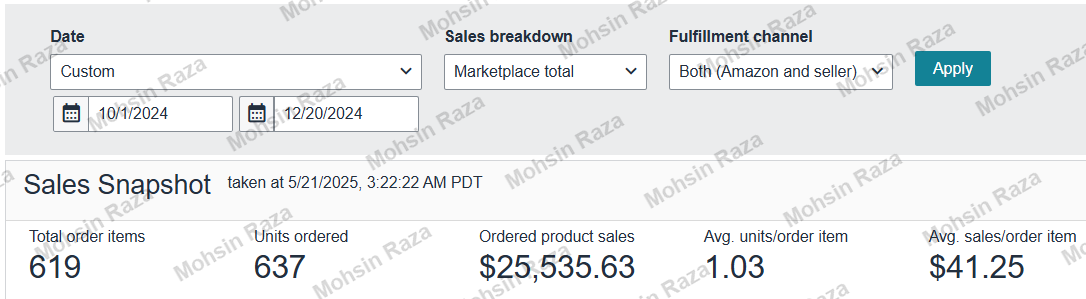
First 2 Months, 20 Days
1 Oct - 20 Dec 2024
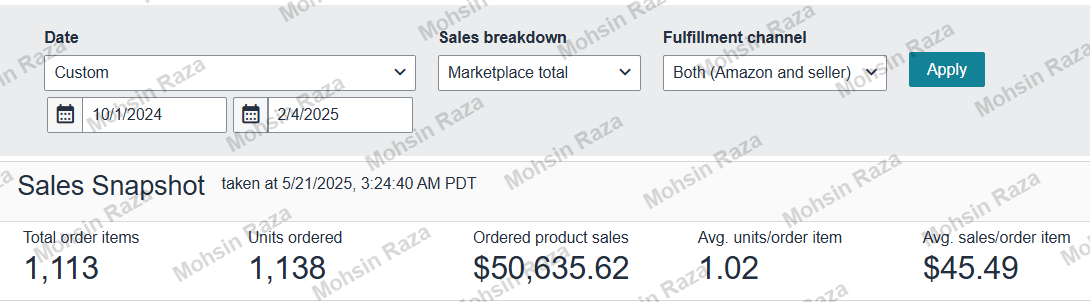
First 4 Months
1 Oct 2024 - 4 Feb 2025
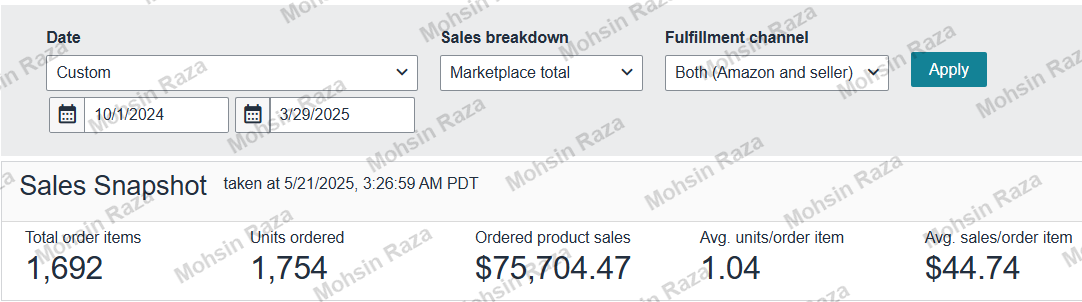
First 6 Months
1 Oct 2024 - 29 Mar 2025
First 7.5 Months
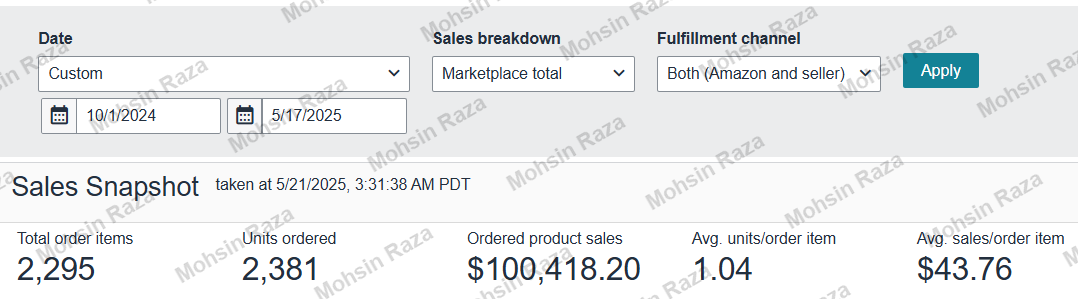
1 Oct 2024 - 17 May 2025
The Road to $100K
in ordered product sales by 17 May 2025
Seven and a half months after launch, cumulative ordered product sales passed $100,000. The climb was steady rather than a single spike: $9,939.47 at 21 days, $25,535.63 at two months and 20 days, $50,635.62 at four months, $75,704.47 at six months, and $100,418.20 at seven and a half. Every step is backed by the Seller Central snapshots above.
Why It Worked
Nothing here was clever. It was a product chosen on margin, a listing that ranked quickly, and advertising that stopped being the main engine as soon as organic demand could carry it.
Margin decided the product
A $24.50 break-even left genuine room to advertise through the launch window without buying unprofitable sales.
Ranking inside a week
Reaching the top of search within seven days meant paid spend compounded organic placement instead of substituting for it.
Demand held after the launch spike
Average sales per order item rose from $40.08 in the first 21 days to $43.76 across the full 7.5 months, so growth was not bought with discounting.